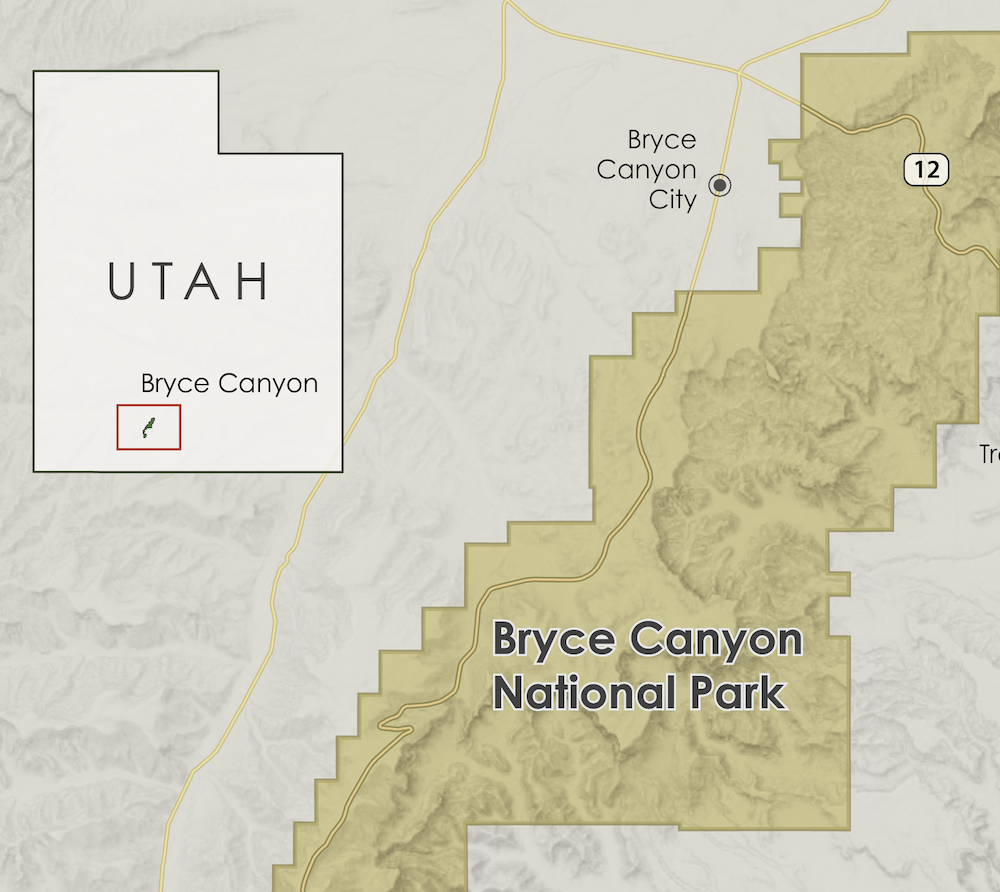
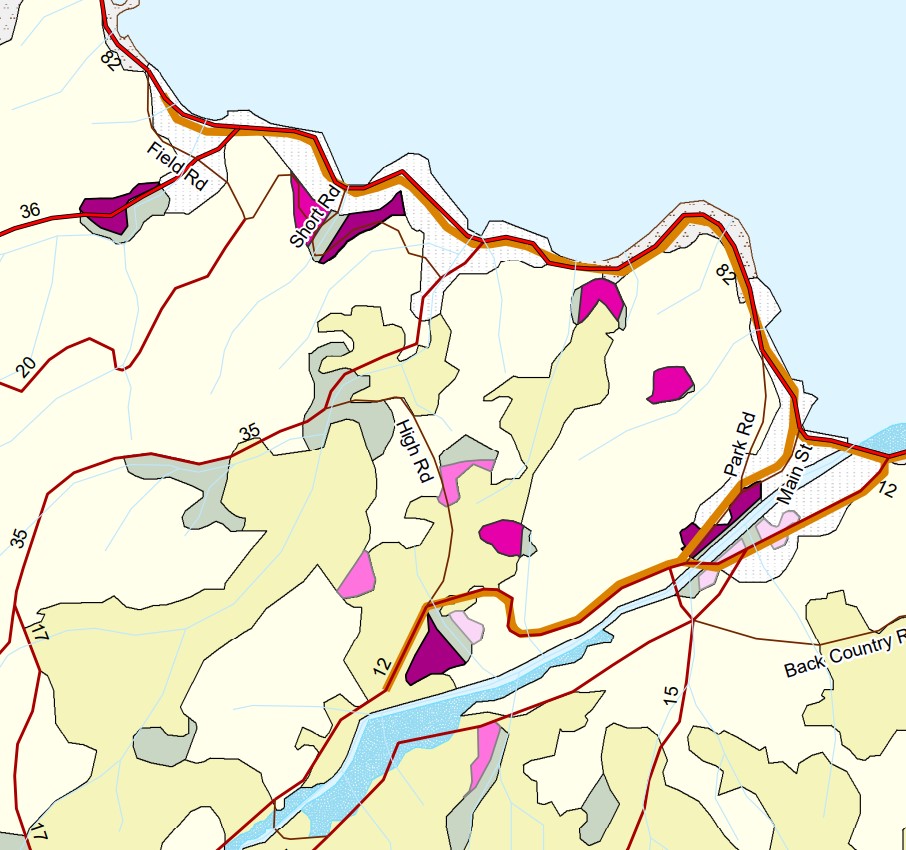
Map for NASA DEVELOP Project
Study area used in the materials created for our partners at the US Forest Service.
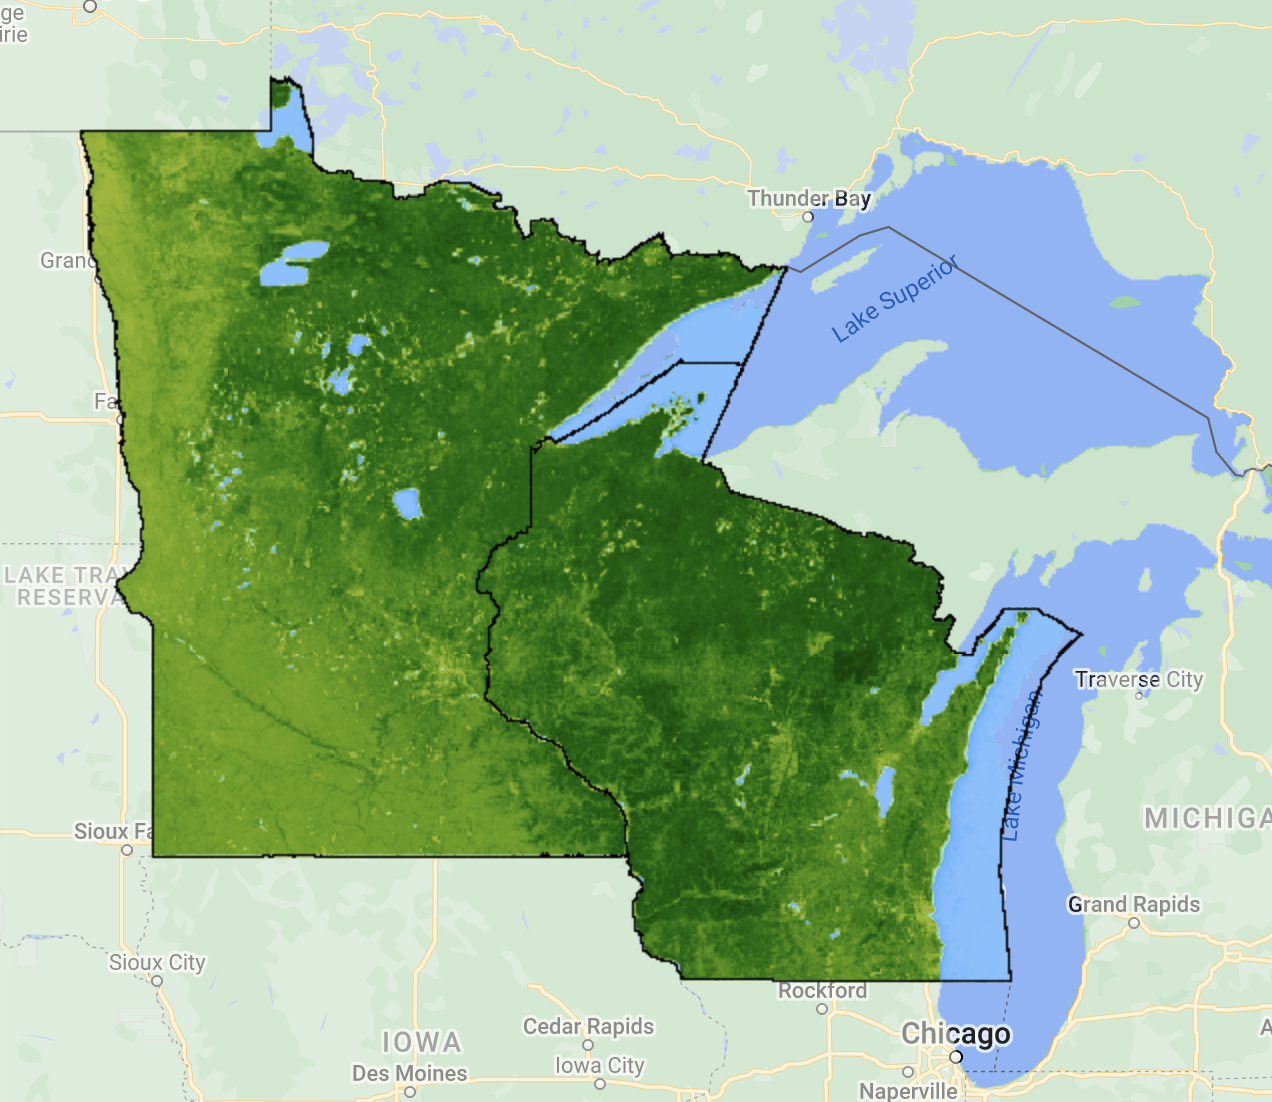
Google Earth Engine Application
A public Google Earth Engine application using remote sensing for change detection and trend analysis within the MN | WI Growing Season.

Top Agricultural Products and Acres Farmed in the US
An infographic that illustrates how many acres in the U.S. are devoted to farmland and top agricultural crop by state.
Nitrate Level Trend Analysis
A JavaScript program with turf.js to interpolate (IDW) the nitrate levels in sample wells, and create a liner regression model.
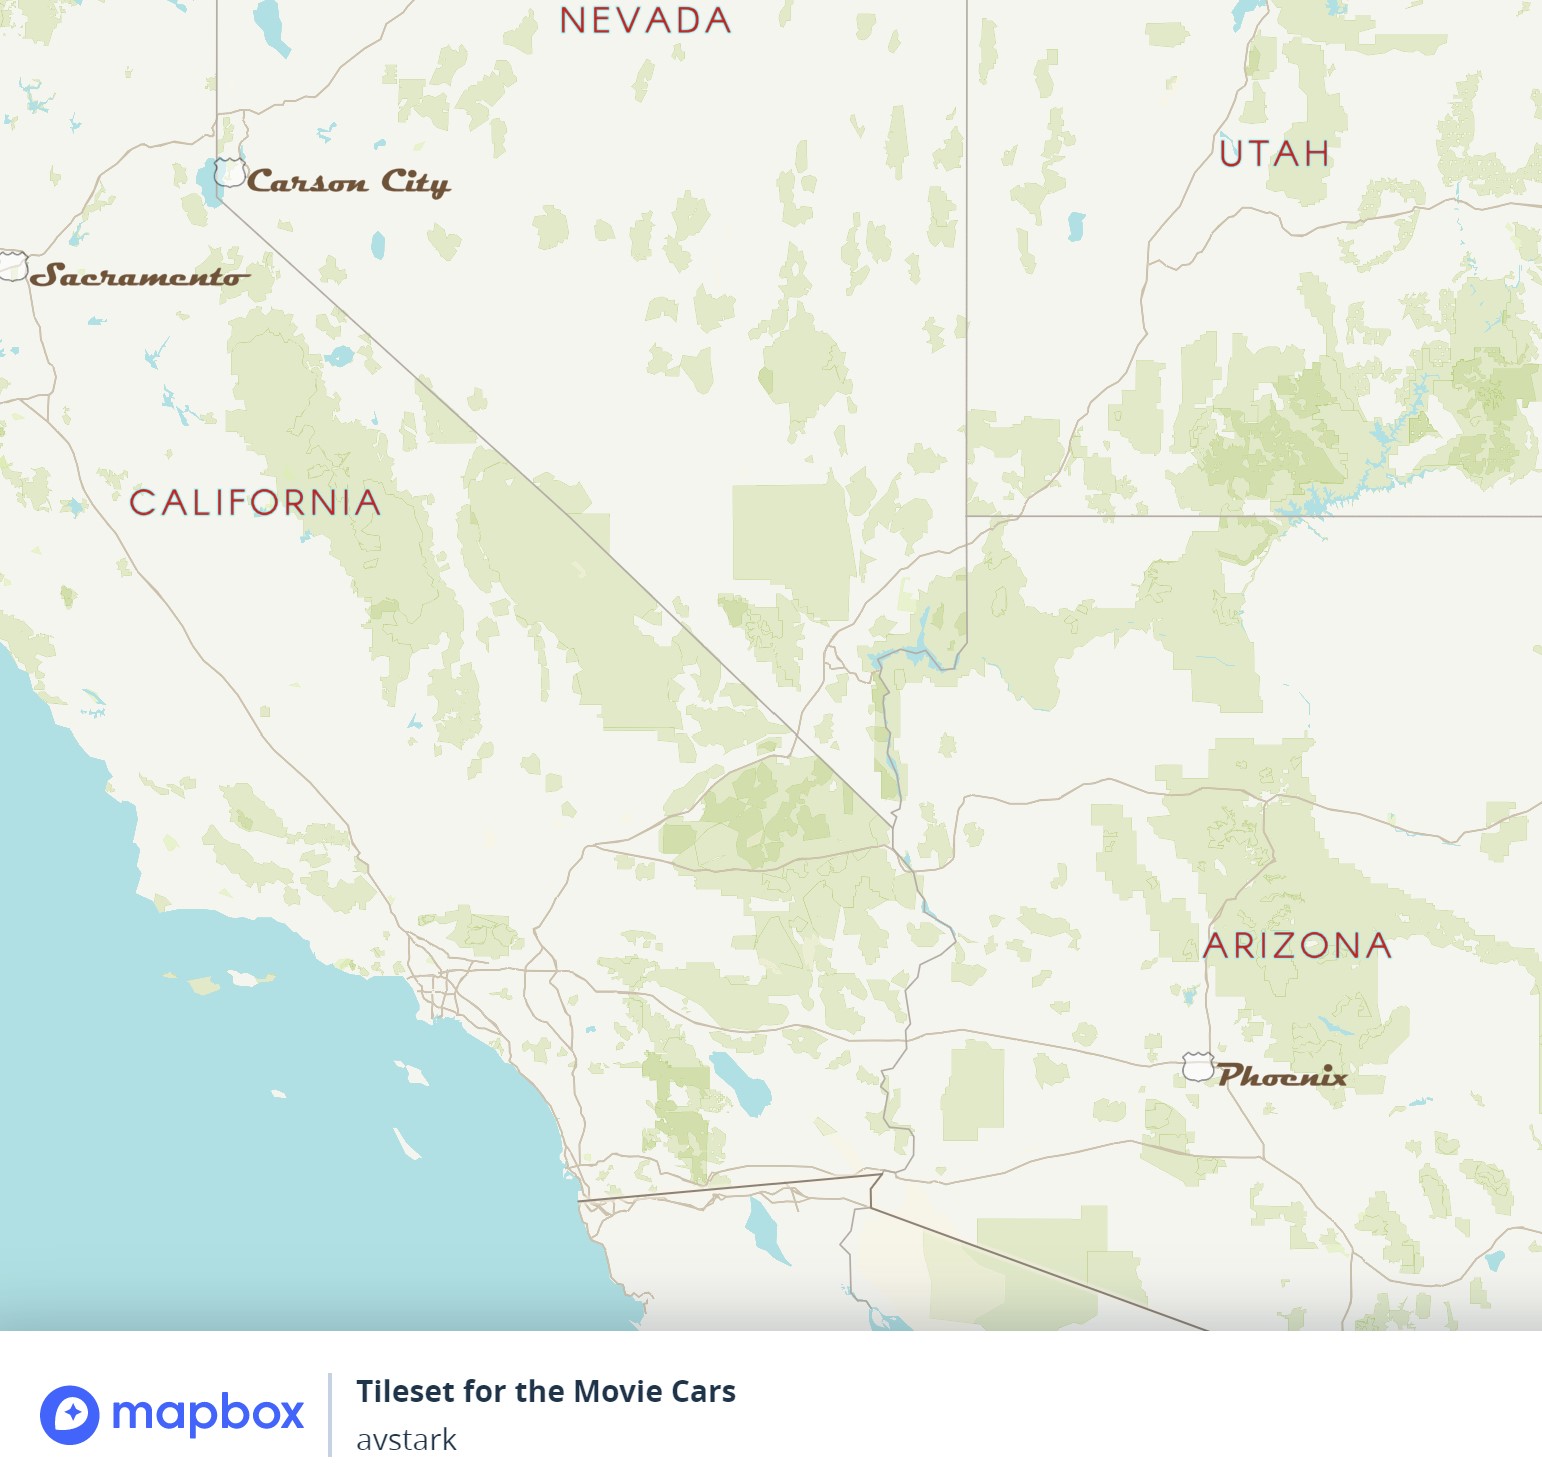
High Desert/"Cars" Tileset
A styled tileset based on the movie "Cars" and created with the Mapbox Studio style editor.
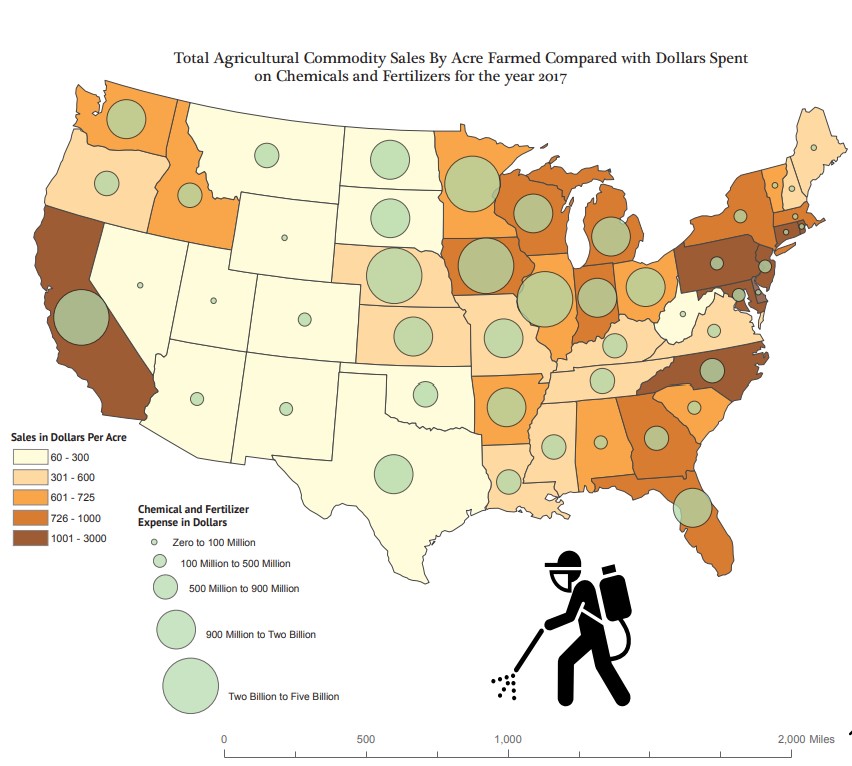
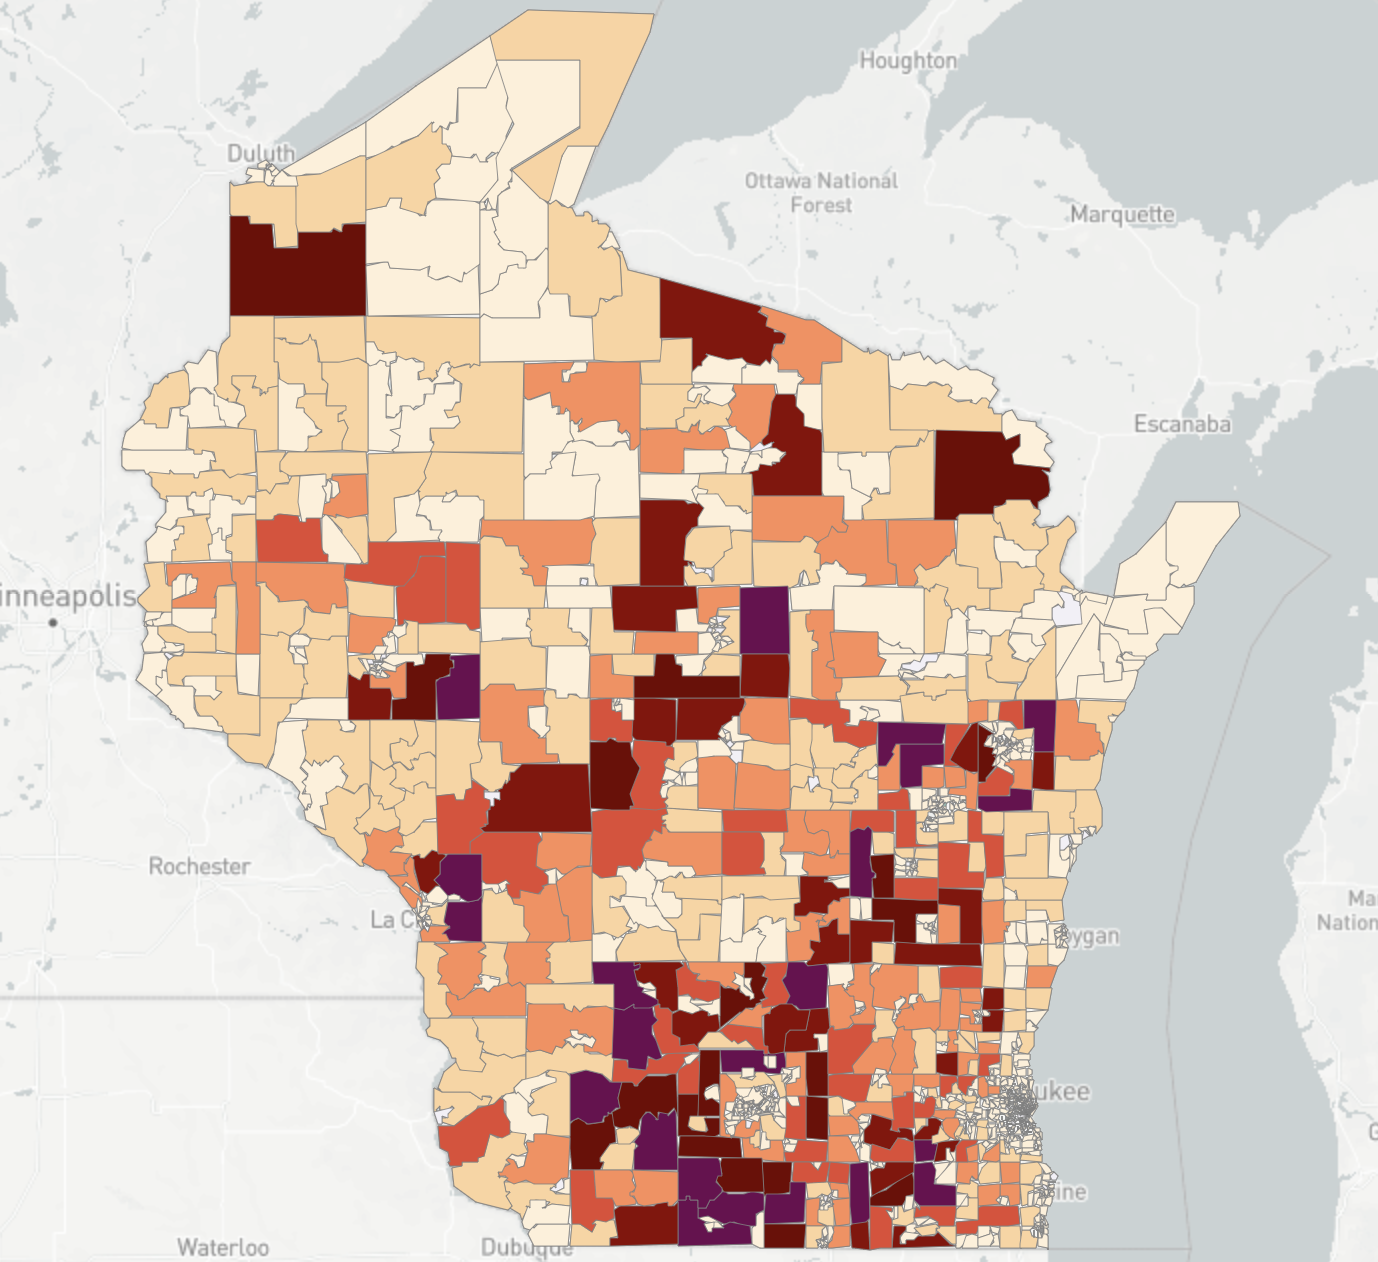
Organic VS. Traditional Farming
Maps illustrating agriculture commodity sales, government payments, and chemical costs per acre of farmland.
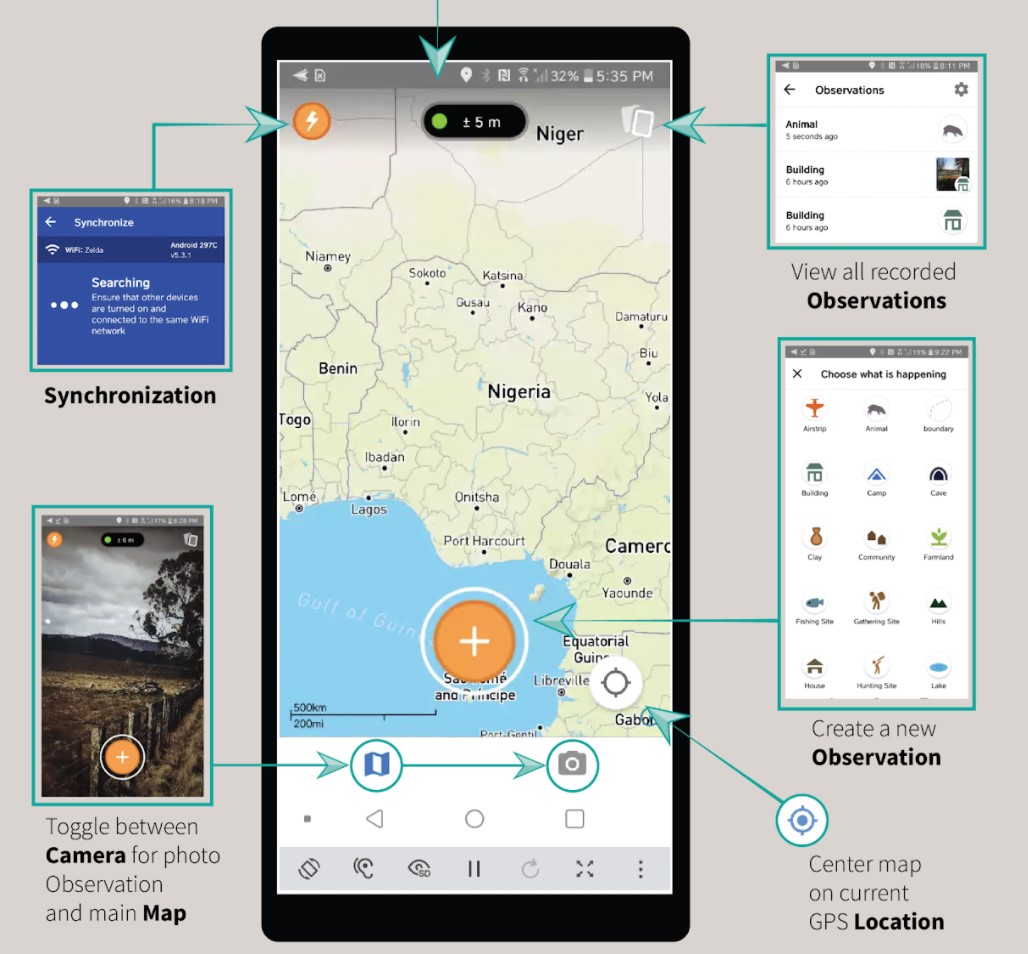
Tutorial for Mapeo
An infographic that demonstrates the various functions within the Mapeo App with limited text
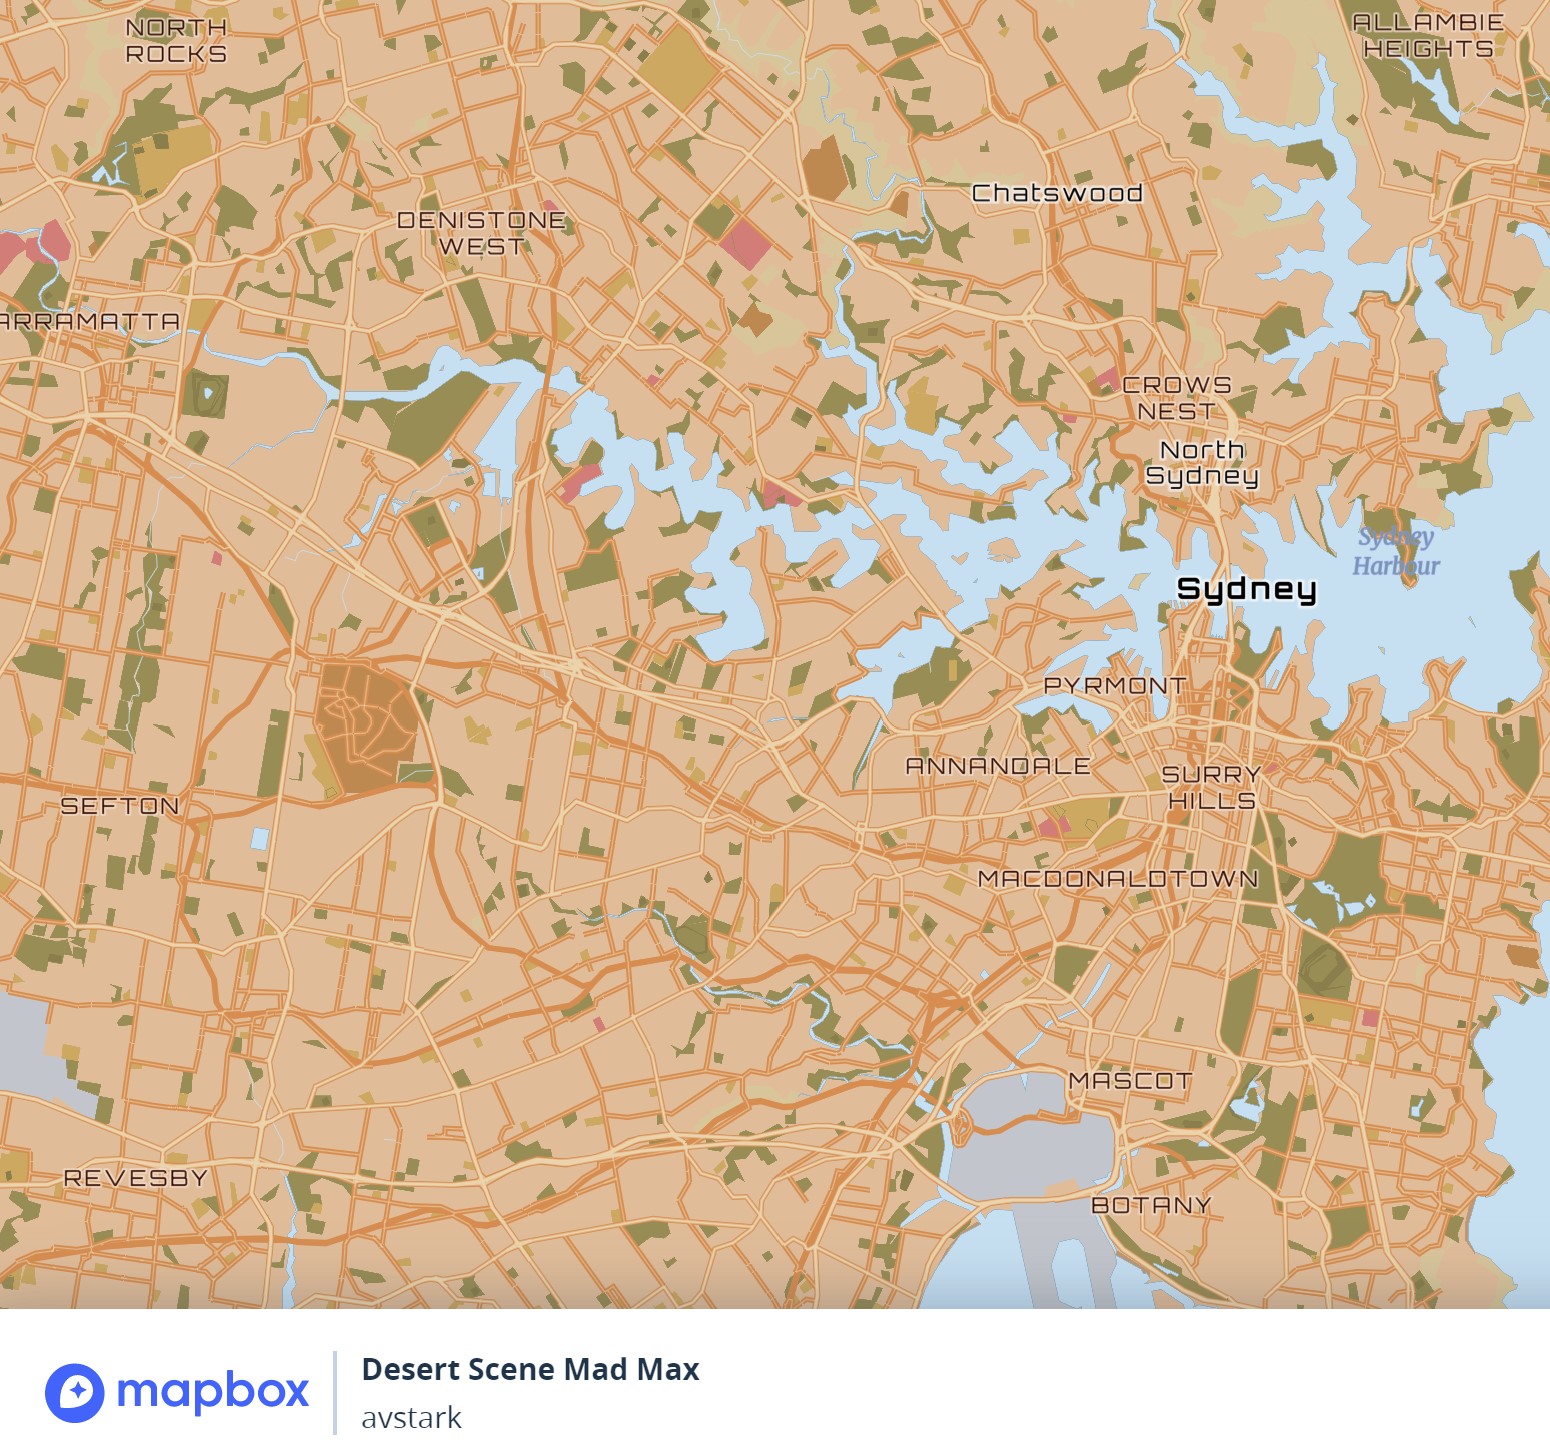
Desert/ "Mad Max" Tileset
A styled tileset based on the movie "Mad Max" and created with the Mapbox Studio style editor.
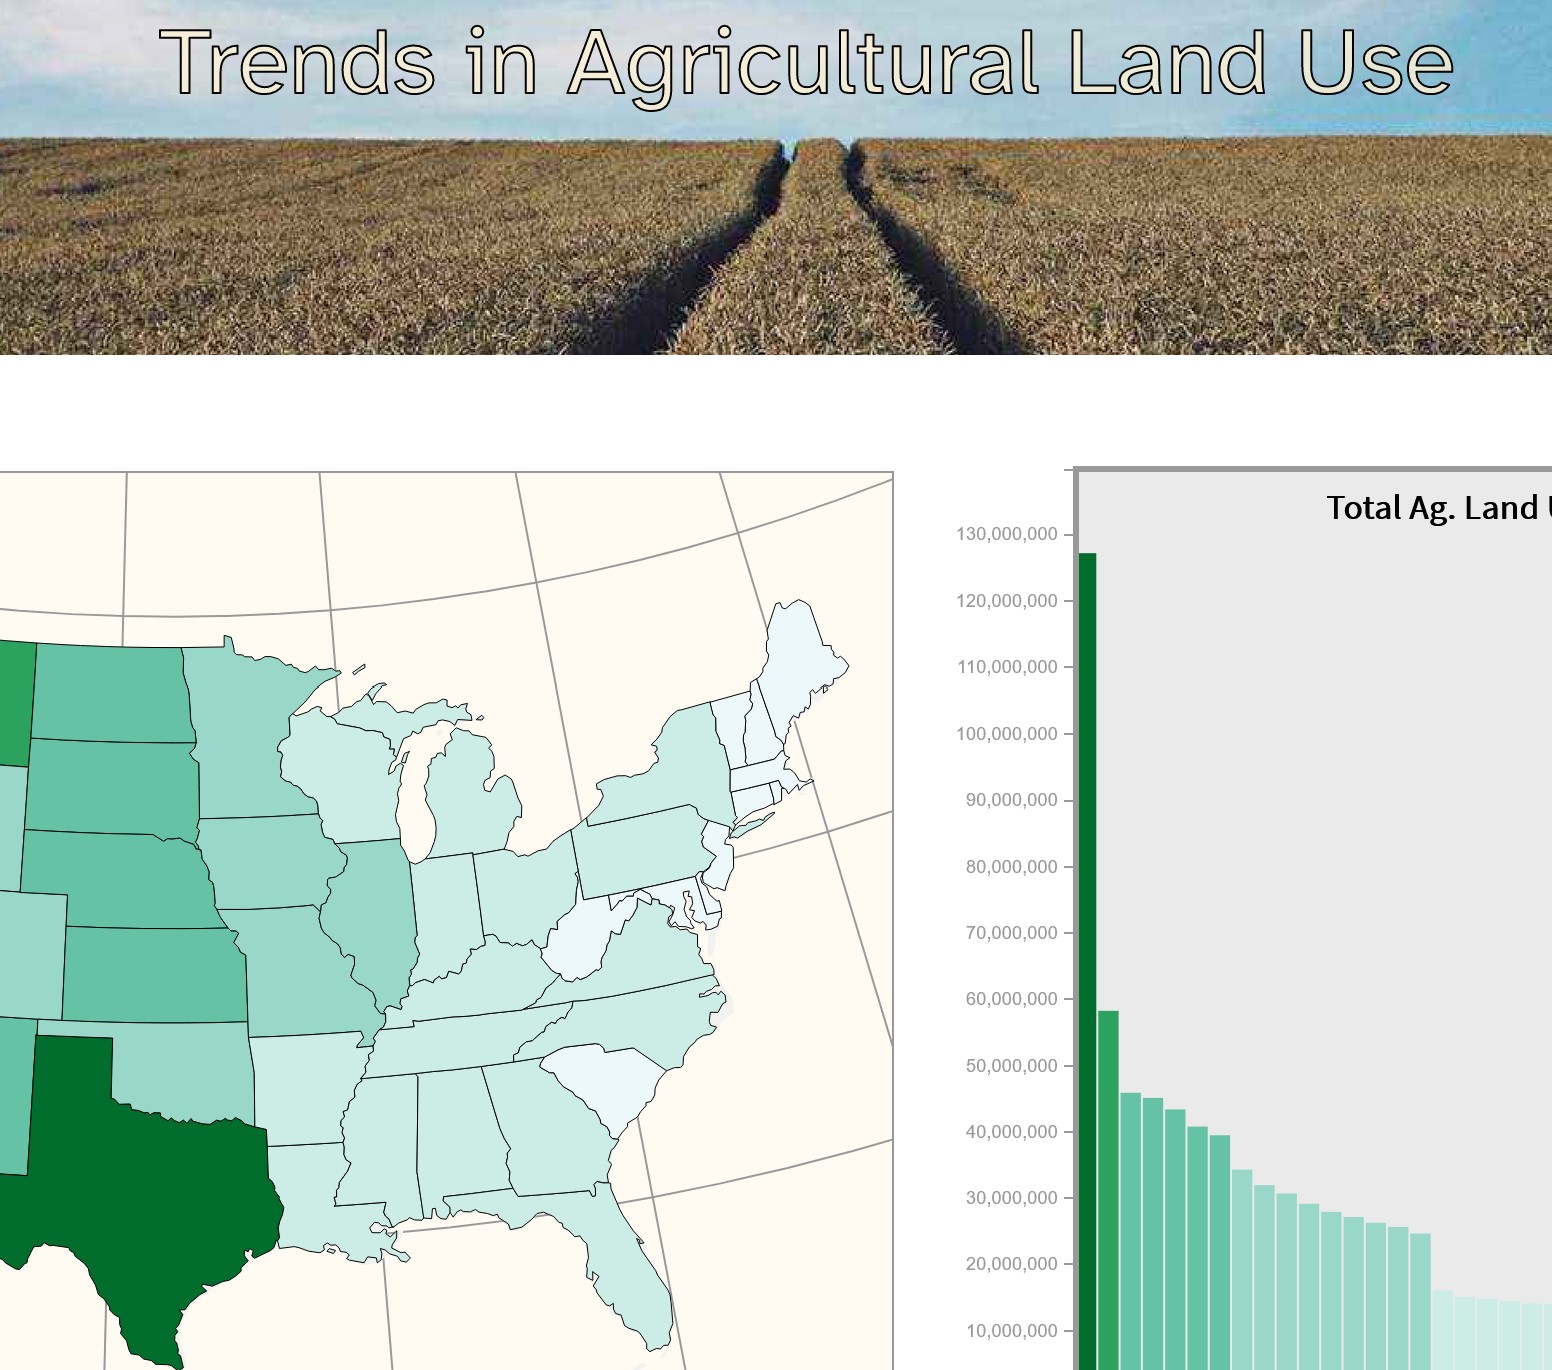
Trends in Ag. Land Use/ JavaScript D3
This map should be viewed on a large screen
Interactive map where user can analyze various trends in recent agricultural land use.
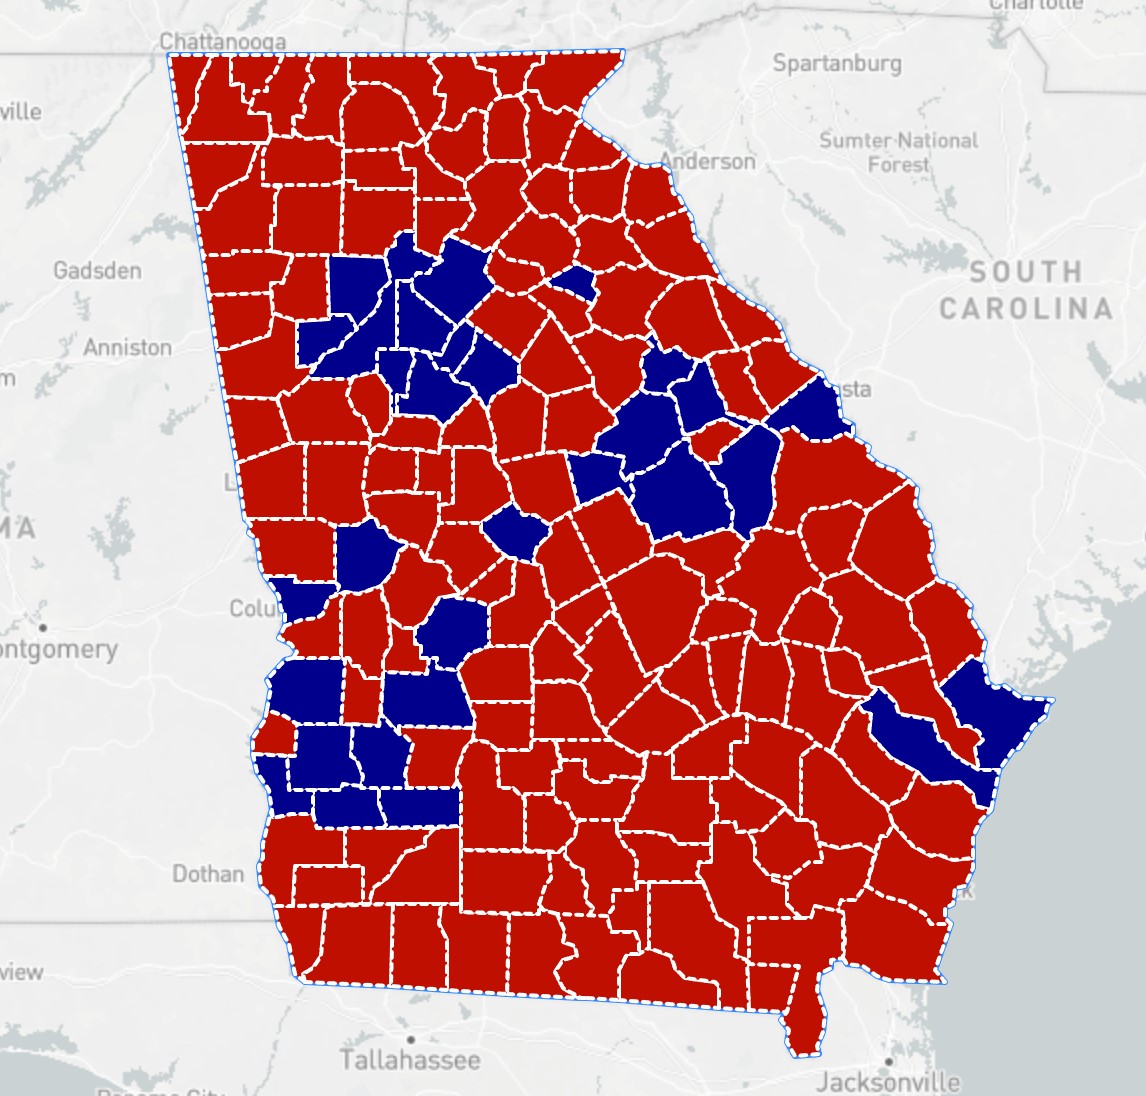
Georgia 2020 Election/ JavaScript Leaflet
Interactive map that allows user to explore possible contributing factors in the 2020 election outcome. Created using JavaScript with JQuery and Leaflet.
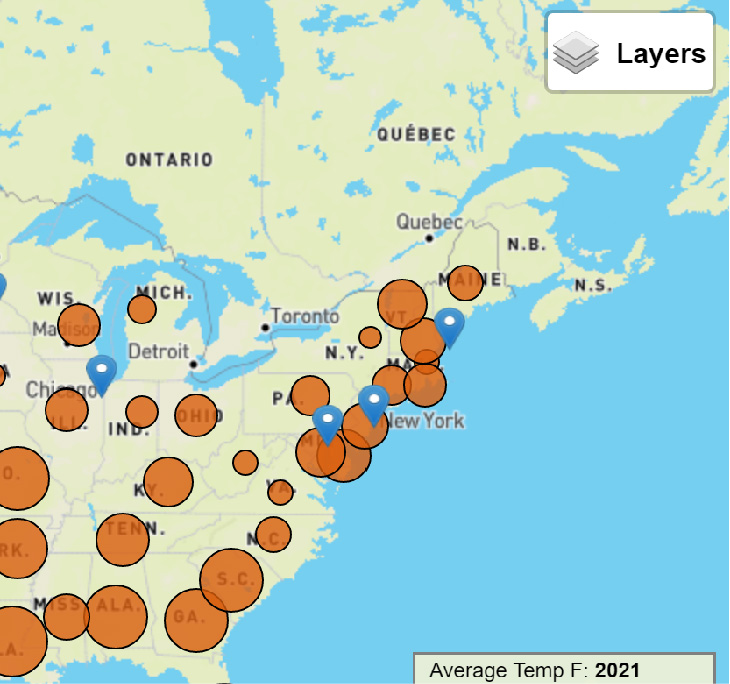
Avg Temp 100 Yrs/ JavaScript Leaflet
Time series proportional symbol map showing average temperatures, with an overlay of potentially impacted cities.
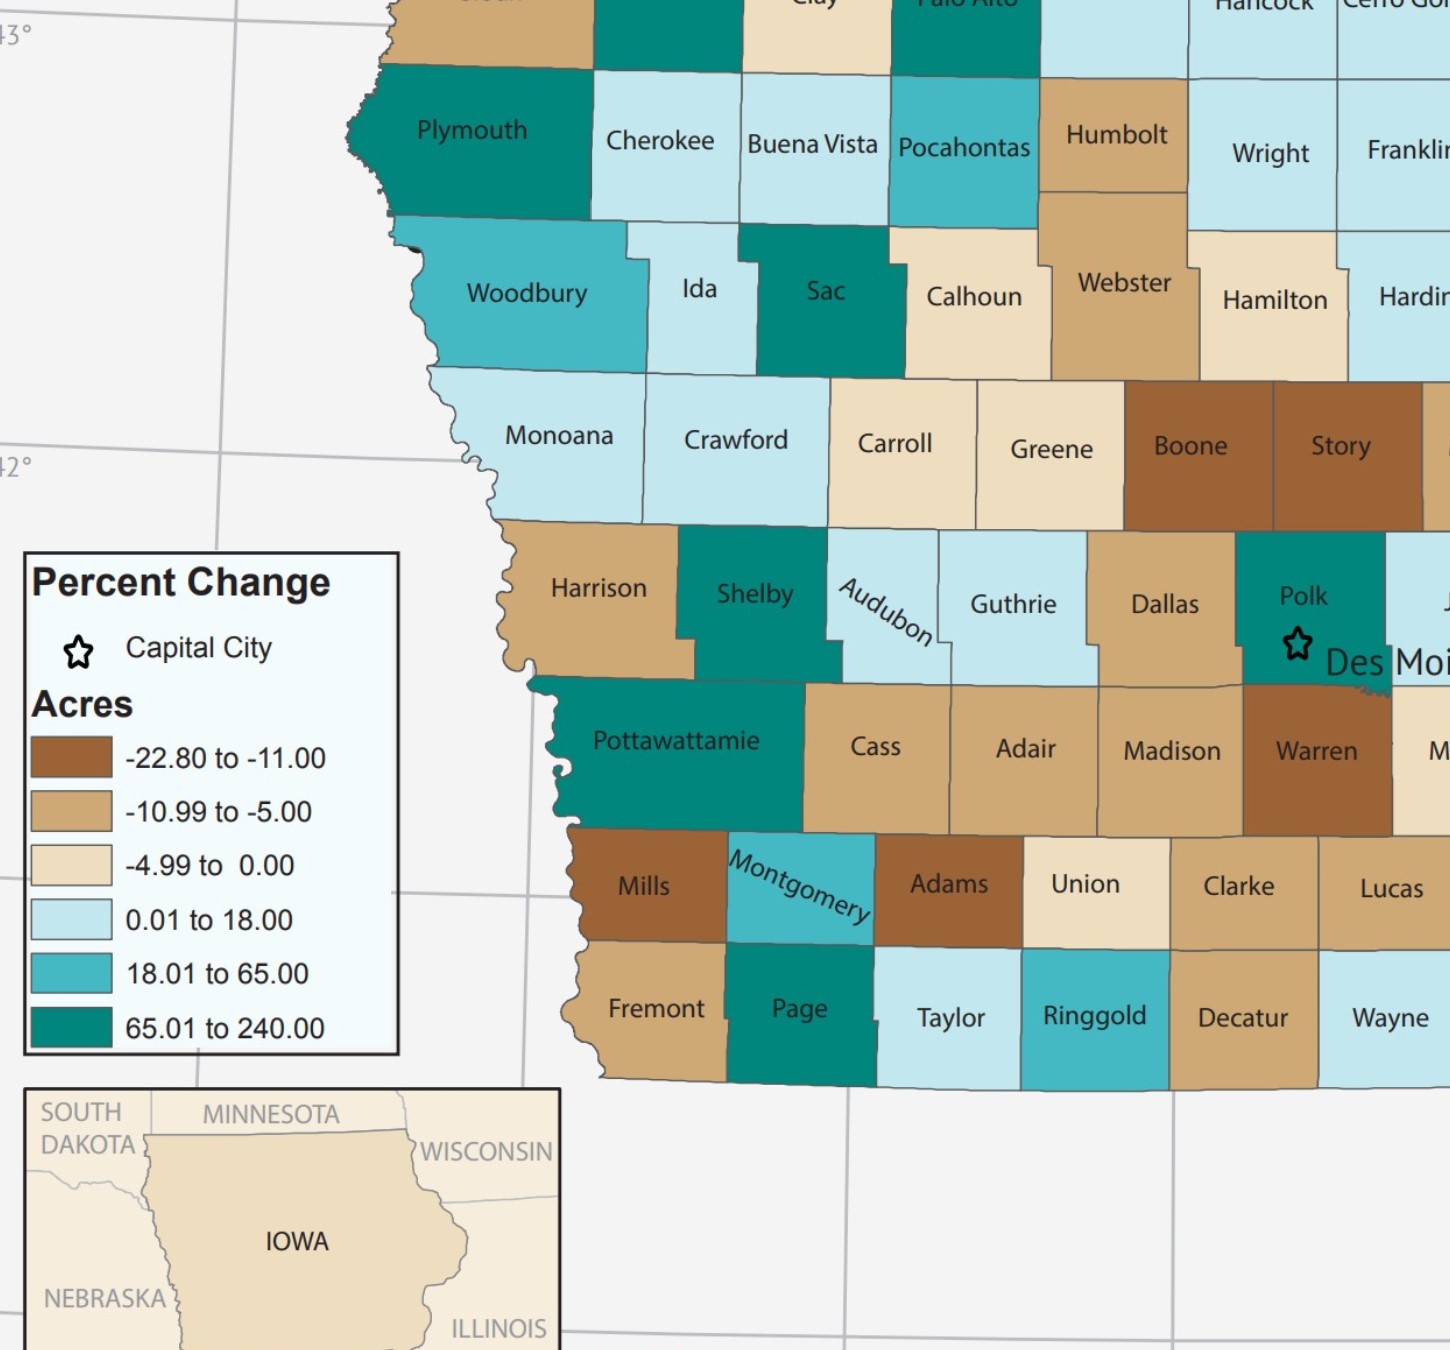
Iowa Farm Size
Map showing the change in individual Iowa farm size over ten years.
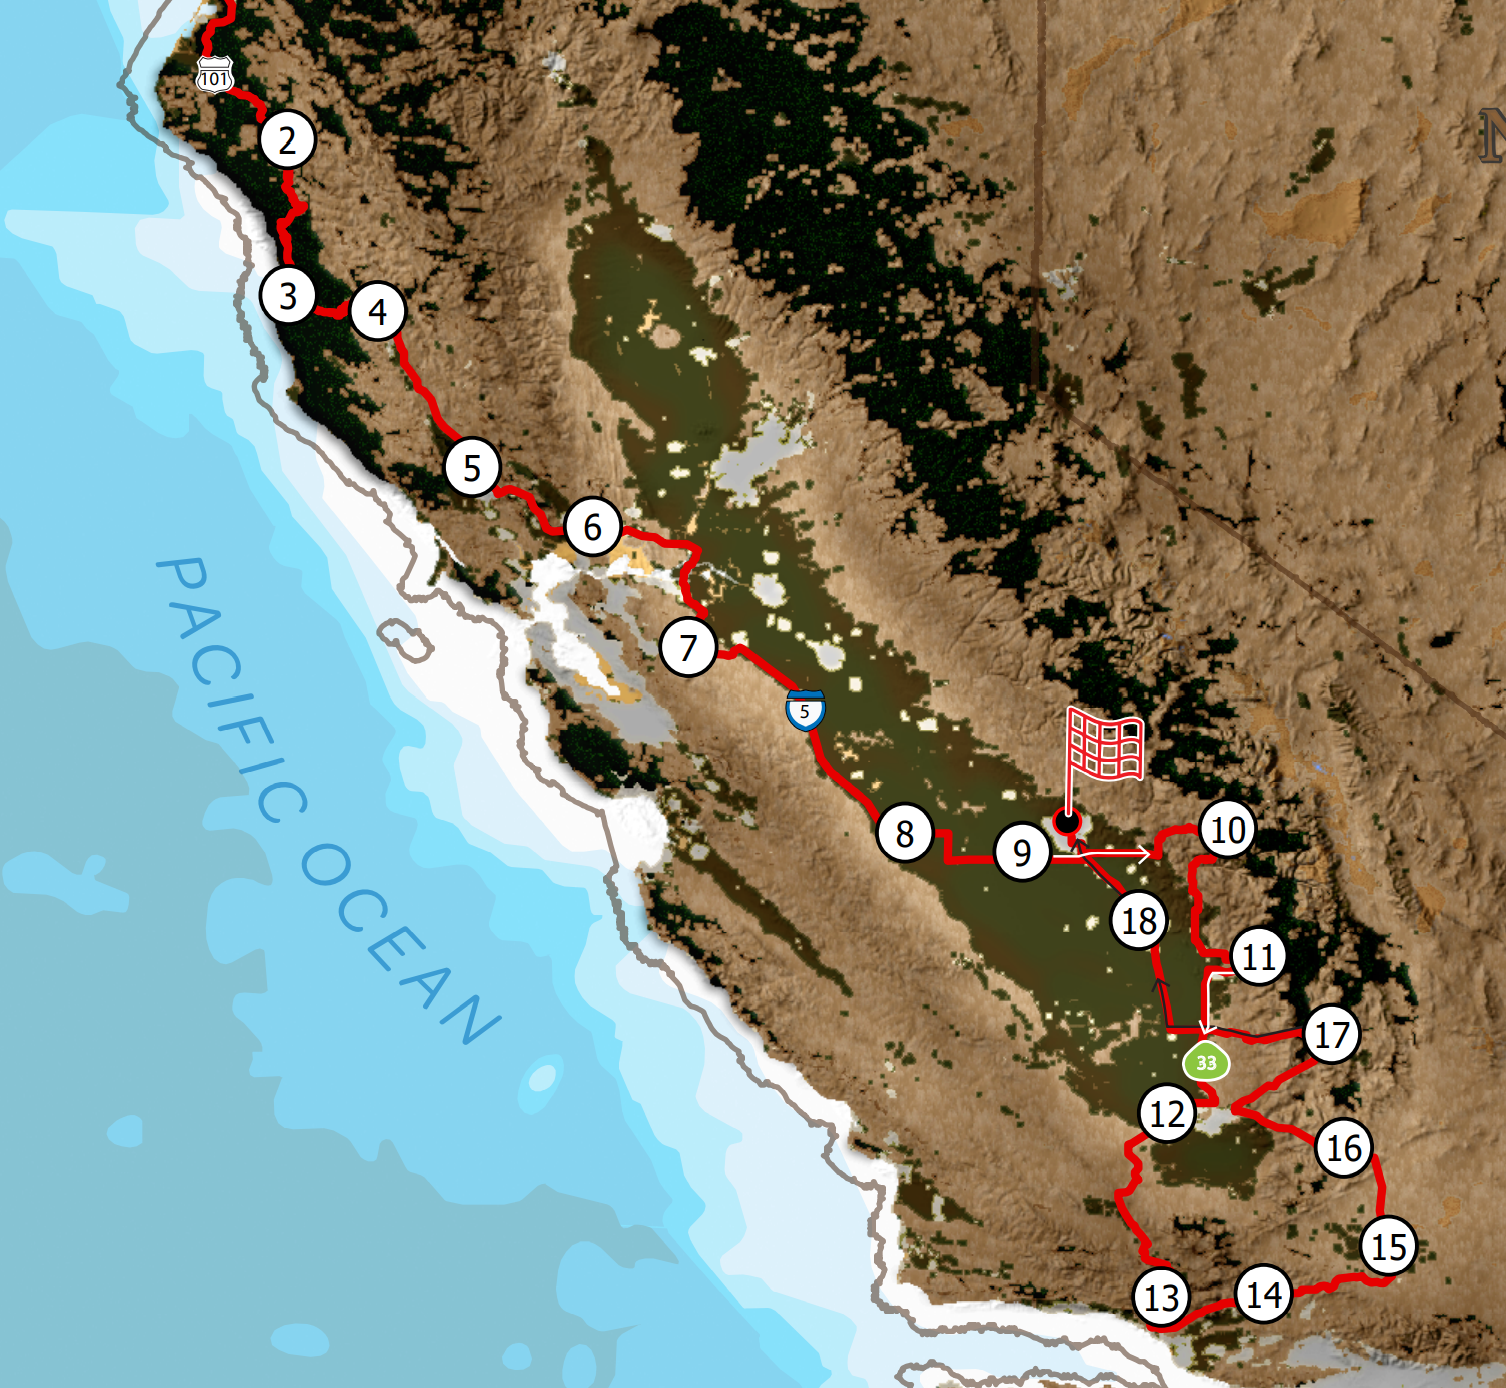
International Bike Tour CA
Proposed Bike Tour through scenic areas of CA with varied elevation and set course miles per day.
Land Use Suitability
Suitability map showing where certain factors overlap and are within a determined buffer zone.